
EROSION CONTROL
Land Management

The Buffalo Bayou is a dark, slow-moving river with the main waterway, known as the "Mother Bayou," flowing through Houston, Texas. The 103-square-mile (270 km2) Buffalo Bayou watershed is critical to the drainage of Houston and surrounding areas. Lying over relatively impervious soils and very flat topography, the bayou has extensive natural floodplains, as do most Gulf coastal rivers and streams. The gradual urbanization of the watershed, starting with the founding of the city in 1836 accelerated in the latter half of the twentieth century, placing thousands of people in the natural floodplain. At the same time, changes to the watershed due to urbanization increased the level and intensity of flood events causing massive shifts in the water's edge.
United Aerial had the opportunity to work with a private client in Houston to monitor land change over their 2.2 miles of land bordering the bayou, utilizing the latest advancements in drone technology and image processing software. In March 2016, our team was able to set over 25 ground control points and later fly the site to collect 1500 high-resolution images covering 60 acres. These pictures were processed to build a high-resolution map and model of the Bayou. In our short flight time, we were able to create a point cloud model with over 61 million survey grade elevation points. With our base model completed in March, we can now use this model to monitor any erosion issues that may occur after a significant rain storm. Unfortunately, it didn’t take long for Houston to experience a big month of rain with April delivering11 inches above average for that time of the year. The quick rain brought heavy flooding to the Houston area, more specifically, along with the Bayou's edge and the adjacent land. After the water had subsided, the edge along our client’s land visibly showed erosion from the rain, but there was no way to measure the soil loss without expensive and timely conventional methods. Fortunately, we already created a base model from March and could now quickly fly and scan the concerned area to build a visual and measurable model that could deliver highly detailed and accurate data. The following report details how United Aerial was able to utilize drone and software image processing technology to monitor these changes in the land.
Flight Pattern
VARIOUS ALTITUDES
For the last several years, Houston has experienced flooding that has left the city under water and searching for a solution to the problem. Aerial imagery cannot only help show where the water is currently moving, but it can also be turned into measurable data to help build a stronger city. United Aerial's goal was to show Houston how to better monitor the Buffalo Bayou utilizing drone technology. With heavy rain expected to hit the city during the early spring, our client wanted to use the latest advancements in drone technology to better monitor their land. With little rain in March, we felt it would be best to use this time to scan the 2.2 miles of the Buffalo Bayou to create a base model. One month later the city was drenched with 14 inches of rain, 11 inches more than the average for April. This left the city under water and damaged in many ways, including housing, transportation infrastructure, and the Buffalo Bayou property. With rainfall of this magnitude, there was no doubt the Buffalo Bayou would be pushing significant amounts of water to the Gulf of Mexico, in doing so, taking land with it. Our team had to wait two months for the water to be released before we were able to work with our client and monitor any changes to their land. The next chapter will better explain how we built our base model in March and then furthermore, how we were able to take our new model in June and compare the changes.

THE FLOODING
Chapter 1: Water Issues


Houston rainfall 2016
Water Levels in Addicks Res near Houston, TX on March 2016

SITE ANALYSIS
Chapter 2: Site Preperation
Site Prep+Flights

As with any flight, United Aerial adhered to all current air traffic and state laws/regulations for the Bayou project. Once the site was cleared to fly, our field team quickly went to work setting up the site for aerial documentation. The first step was to visit the site and inspect the surrounding area for any vertical obstacles which might alter our flight path. For instance, with large trees surrounding the area, we adjusted our altitude requirements for proper clearance. We then built our flight plan based on the area coverage and distance to be flown. The next step was to set the ground control points that would later be tied into our point model, ensuring an accurate output. Using a Trimble total station, we set 27 ground control points along the water's edge. 23 of these points would be utilized as GCPs, while four would be used as control points to ensure model accuracy.


OPERATIONS
Chapter 3: Take Flight

After the ground control points had been set and the nearby air traffic control tower was notified of our flight plan, it was time to take to the air. The DJI Inspire 1 was the perfect aerial vehicle for the job, with its great endurance, high definition camera, and impressive flight controls, we were able to safely and efficiently capture the images we needed in 4 hours time.
By breaking down the 2.2 miles into four sections, we were able to fly each half mile three times, pointing the camera in different directions to capture every piece of land. By utilizing autonomous flight software, we were able to fly each section at the exact height, speed, and camera direction, which gave us accurate and unified data.


In total, we were able to capture nearly 1500 high resolution, geo-tagged images that would later process to build a ultra-high-resolution map and densified point cloud model. Now it was time to process the data.

PROCESSING
Chapter 4: Point Cloud Model

Processing nearly 1500 images is no easy task for the computer sitting on your desk, which is why we relied on virtual servers to handle the workload. Utilizing the latest advancements in VS, our team was able to process the entire job in under 8 hours, producing a ultra-high-resolution map and a point cloud model that we could deliver to our client in a matter of 2 days.
The ultra-high-resolution map provides an accuracy of 1 cm and a resolution 15x greater than Google Earth. Our client was now able to inspect and measure every square inch of their property visually. The map is a vital role in monitoring their land erosion issues, and the point cloud model will now offer them an unprecedented amount of measurable data, with over 59 million points collected on site. Their 2.2 miles of Buffalo Bayou can now be treated as a highly detailed, accurate 3D model.


CLOUD COMPARE
Chapter 5: Erosion Monitoring

United Aerial's goal for our client was to have the ability to measure any loss of land along their banks throughout the year. With traditional survey methods taking weeks to perform and not producing the results our client was looking for, they were excited to test this new technology after the rain in April. With our base model from March of 2016, we were able to monitor and measure any damage to their banks. After they have located a concerned area on their property, they quickly contacted our team to perform another scan along the bayou to build a report on exactly how much land was taken away following the flood.
In just a few short days, our team was able to hand over a detailed land loss report, with measurements down to shovel head. The client was then able to use this information to work with civil engineers, designers, and the city to take preventive land loss measures, saving their property from any more issues. The following images and report will better illustrate how United Aerial was able to scan the Buffalo Bayou and compile two point cloud models to locate the delta in the land.

To examine the area of concern, we used our base point cloud model from March 2016 and then merged our new scan from June 2016.


Side by side, the models visually show us a change in the bank. However, this is only the beginning for our exploration as to how much land, if any has been lost due to the extreme rainfall.


Once we have the two models merged, we isolated the area of concern and began calculating the delta.


To calculate any loss, we inspect the area for land loss based on our scale value, confirming their concerns on erosion. To build a report, we need to cut sections of the concerned area, then extract measurable data.
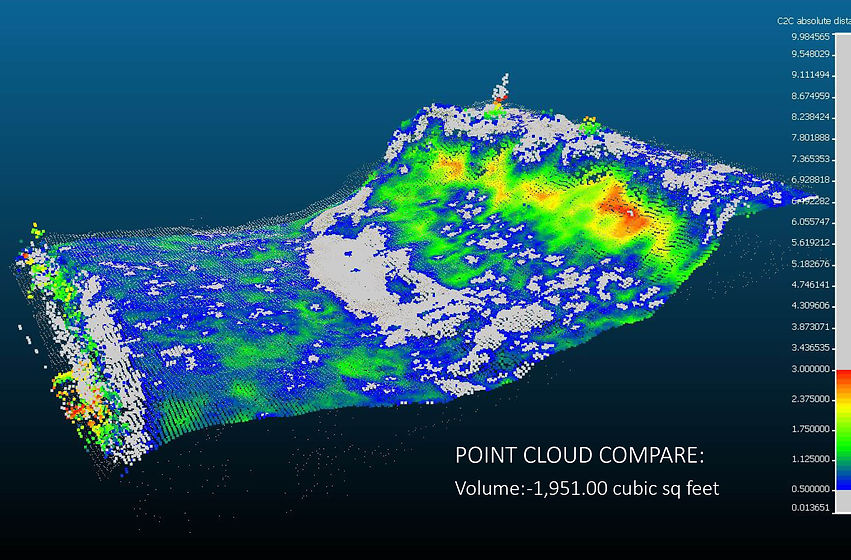
The 75-foot section cut clearly indicates a loss of land ranging from .5 feet to just under 3 feet. The gray coloring above shows land loss ranging from .01 feet to .5 feet, with the red coloring being the highest change regarding soil loss. In all, we were able to calculate nearly 27 cubic yards of soil had been removed since March.

This cross section shows how much land was lost after the April flooding, red indicating over 3 feet of land lost. Section cuts like this one were produced along the area of concern to visually show the damage along our client's property, giving them a detailed and highly accurate measurement of any damage.